OVERVIEW
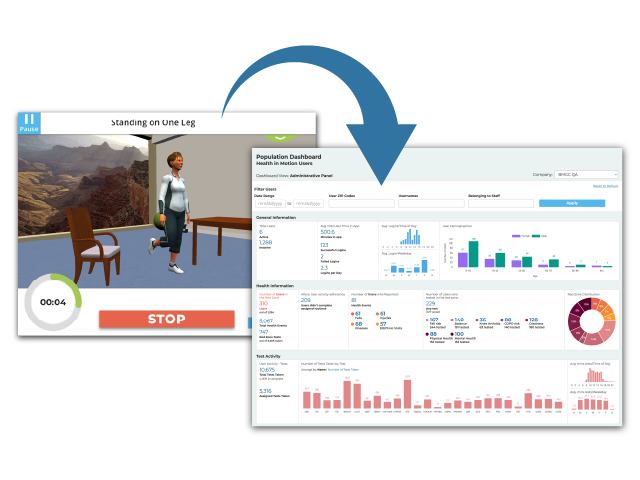
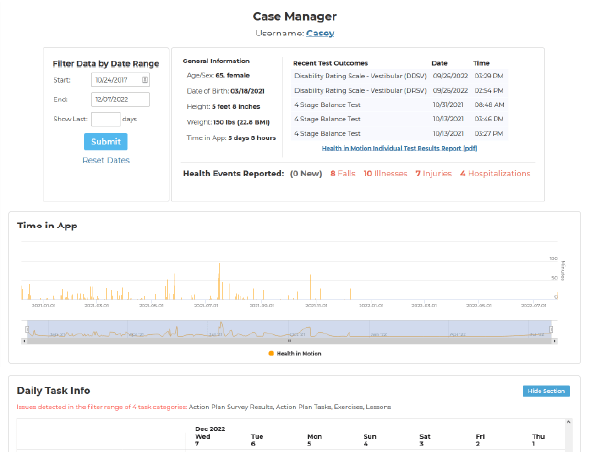
A majority of my time at Blue Marble has been spent working on Health in Motion and other Unity-based apps. These apps collect performance data from patients and send them to the companies clinician-facing website, that we refer to as the Clinician Dashboard. Here the data is organized and presented to clinicians so that they can assess and track the performance of their patients which helps them to make recommendations for their physical therapy or other take other actions.


As part of my foray into web development, I’ve taken on some features of the Clinician Dashboard. Here are some examples:
Biometric Stats and Graphing
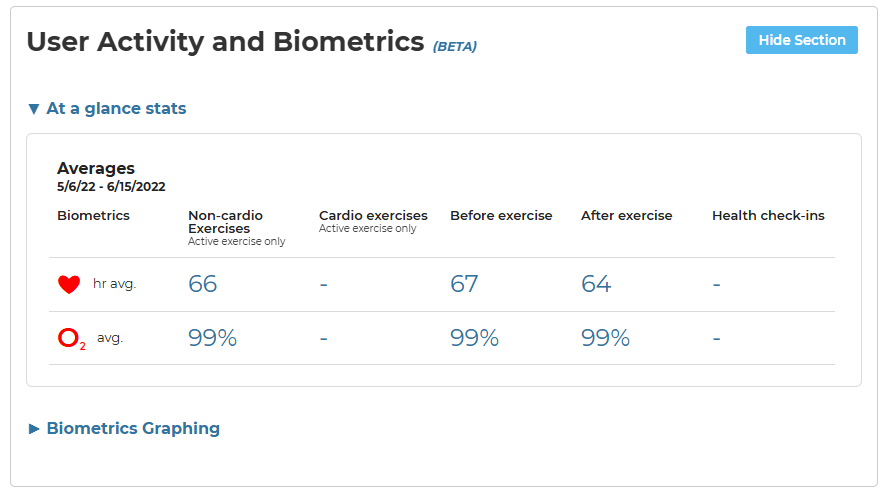
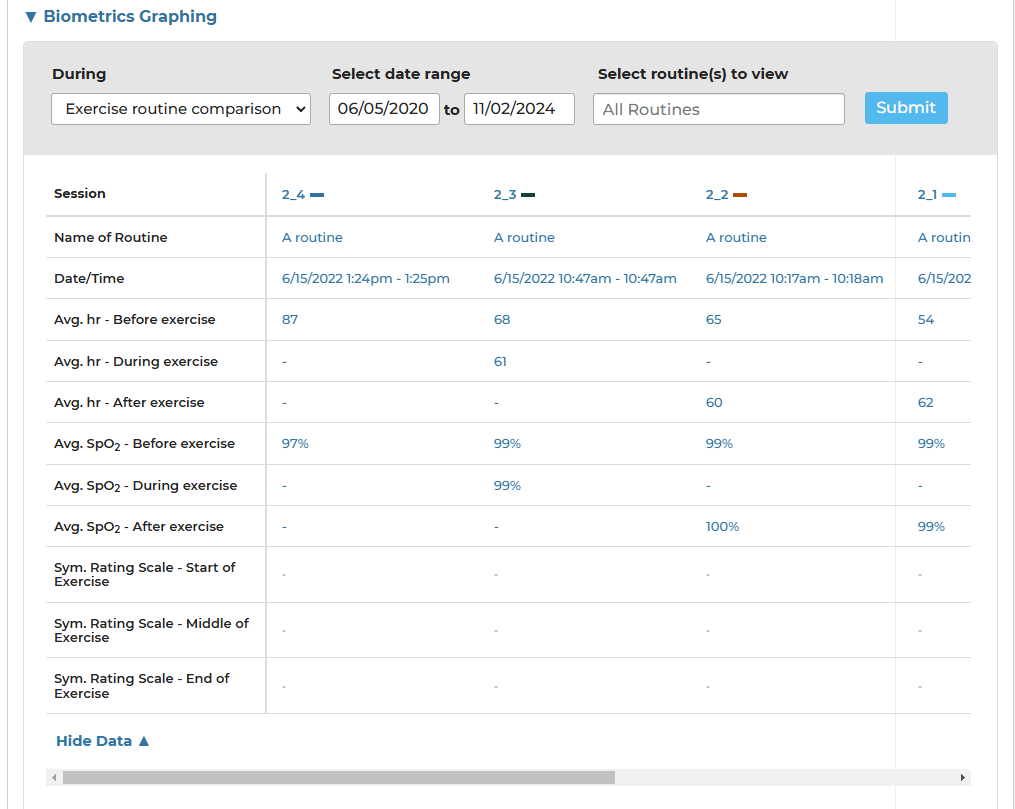
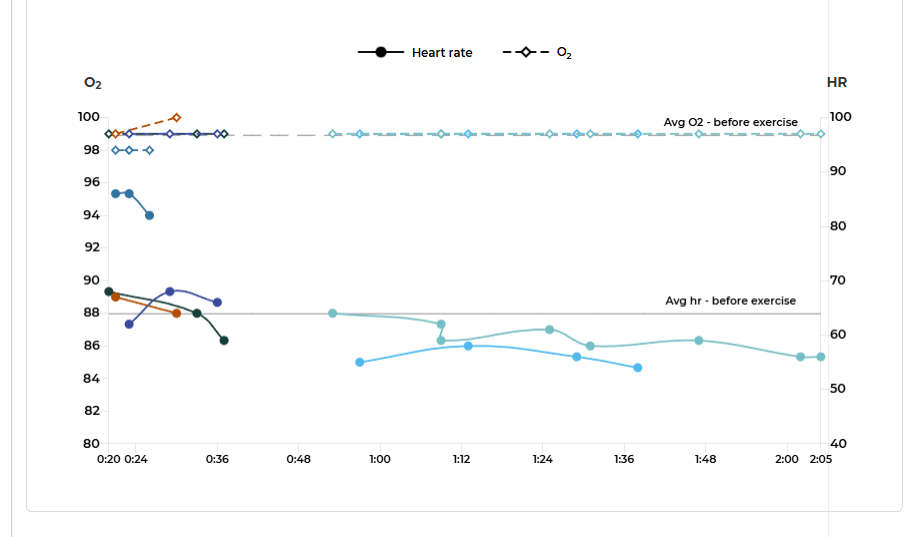
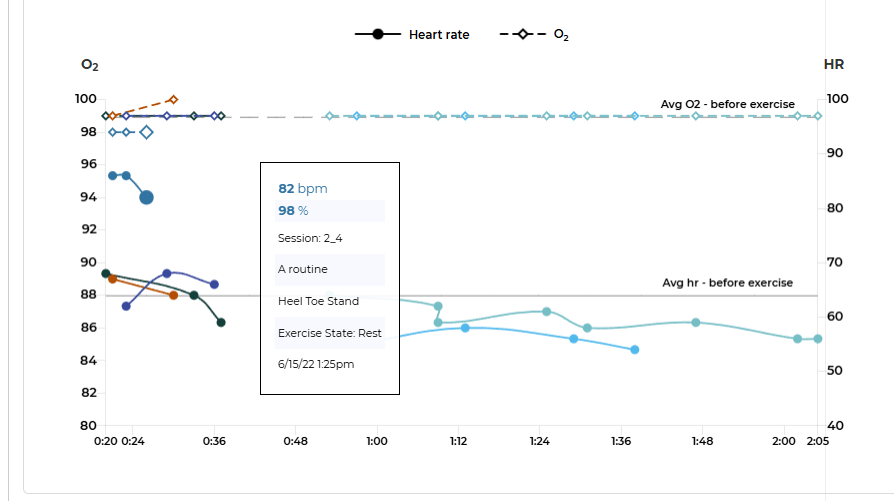
As part of my recent work on Health in Motion v5, I implemented a Bluetooth Pulse Oximeter connection to gather oxygen saturation and heartrate data during exercise routines. So it was a natural fit for me to implement this Biometric Stats and Graphing section.
It consists of an “At a glance” section (where a summary of stats is displayed for different stages/modes of exercise), a table displaying columns for each routine where biometric data was captured, and a graph section where the data from multiple routines is overlaid together. The table and graphs are controlled by a filter section.
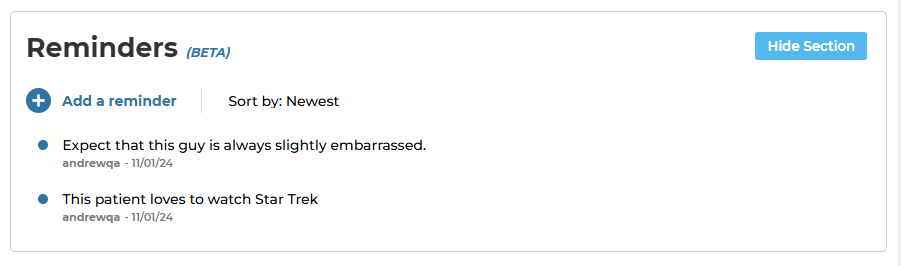
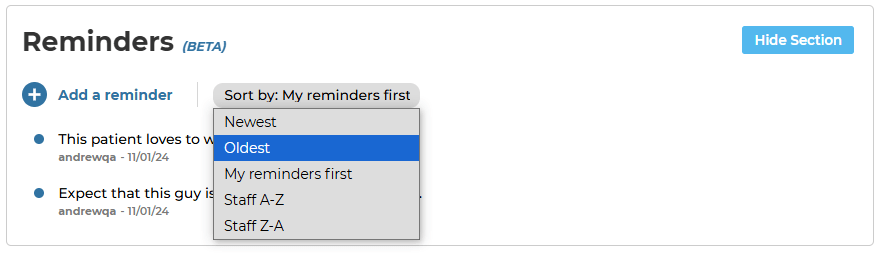
Reminders
This section lets clinicians create reminders about patients in order to keep track of things that can’t be displayed anywhere else on the Dashboard. Clinicians can add, edit, delete, and sort reminders. It’s a fairly simple feature, but it gave me more experience working all of the aspects of full stack development. For example: I had to learn how to add new data to our database, as well as edit and delete it.